
The Weekly Petroleum Status Report for the week ended September 18 was neutral to unsupportive for crude oil, but bullish for distillates and gasoline. The agency reported a slightly smaller than expected draw from crude oil inventories, but a sizeable surprise draw from distillate stocks and a sharper than expected drop in gasoline inventories. Crack spread were widening, consistent with these data, as WTI futures were up by one percent, while RBOB and ULSD (HO) futures were seeing gains of two percent as of this writing.
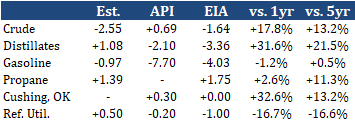
Commercial crude oil inventories saw a slightly smaller than expected, counter-seasonal draw last week. Stock levels fell by 1.64mb to 494.41mb, trimming the surplus over the five-year average to 13.2% and putting the surplus over last year at 17.8%. Stocks typically rise from mid-September through late November, according to the five-year average, as refineries scale back production for maintenance operations and retooling for the winter. Stock levels at the Cushing, OK storage hub (and delivery point for the WTI futures contract traded on NYMEX) follow a similar pattern, although the five-year average has stocks turning lower later, at the end of December. Cushing stocks held steady last week at 54.28mb, which is 32.6% higher than last year and elevated by 13.2% over the five-year average.
The very active Atlantic hurricane season continues to show up in the data. US oil production fell by 0.20mb/d last week, averaging 10.70mb/d and 1.80mb/d weaker than last year as operations were curbed due to Hurricane Sally. This is only the second season in history in which all 21 Roman alphabet storm names have been used up, and we are now on the second letter of the Greek alphabet (post-tropical cyclone Beta). Refinery runs also fell last week, by 0.12mb/d to an average of 13.37mb/d - but this was due to a 0.28mb/d drop in Midwestern runs. Gulf Coast runs increased by 0.18mb/d to 7.03mb/d. Runs are very weak amid depressed demand during the pandemic, averaging 13.37mb/d last week - a 3.14mb/d drop from the same week last year. Exports picked up by 0.43mb/d last week, averaging 3.02mb/d and helping towards the weekly draw along with the aforementioned dip in production. On the other hand, imports rose marginally - by 0.16mb/d to average 5.17mb/d.
Distillate stocks saw a surprise but seasonal draw of 3.36mb last week, on a jump in implied demand. Implied demand shot up by 1.15mb/d to an average of 3.96mb/d, which is flat to last year, recovering after the dip seen amid Hurricane Laura slamming the Gulf Coast. The draw might have been larger, had not exports slowed marginally to 1.13mb/d, imports not edged higher to average 0.14mb/d, and had production not done the same, averaging 4.47mb/d last week. Exports are still 0.50mb/d lower than last year, likely due to depressed foreign demand with the pandemic, and production is still 0.53mb/d lower than last year as well. Adding to the bullish punch of this morning's data, the East Coast saw nearly half of the weekly stock draw, with region inventories falling 1.61mb to 63.75mb. At 63.75mb, PADD 1 inventories are 23.6% stronger than their five-year average and a whopping 52.7% stronger than last year. US inventories are 21.5% higher than their five-year average and 31.6% stronger than last year. Although analysts had predicted a build for last week, stock levels typically fall from early September through mid-November, according to the five-year trend.
Gasoline stockpiles, expected to fall by 0.97mb, saw a sharper drop of 4.03mb last week on stronger net exports and implied demand. Exports picked up by 0.24mb/d, averaging 0.75mb/d and just 0.06mb/d lower than last year. Meanwhile, imports fell by 0.13mb/d to average 0.47mb/d - which is 0.33mb/d lower than last year. Also putting pressure on inventories, implied demand ticked 0.04mb/d higher, averaging 8.52mb/d. Still, this demand remains depressed due to the pandemic - down by 0.83mb/d from the same week last year and well below the five-year range for the week. Production rebounded last week, amid the rise in Gulf Coast refining activity, by 0.50mb/d to an average of 9.32mb/d, still 0.93mb/d lower than last year.
Combined propane and propylene stock levels saw a slightly larger than predicted, seasonal build last week. Inventories increased by 1.75mb to reach 97.89mb, which is 2.6% higher than last year and a healthy 11.3% above the five-year average. The build was helped along by a 0.07mb/d rise in production (averaging 2.23mb/d), a 0.02mb/d uptick in imports (to 0.11mb/d) and - mostly - by a 0.43mb/d drop in implied demand, averaging 1.05mb/d and 0.41mb/d lower than the same week last year. The Gulf Coast saw the largest build, with inventories rising by 0.90mb/d to 55.85mb/d and to a 12.3% surplus over historical levels. The East Coast saw the next largest rise, of 0.54mb to 9.13mb, and PADD 1 inventories are now 31.7% higher than their five-year average. Midwestern inventories added just 0.11mb last week, but are still 0.8% higher than their historical average, having reached 27.45mb. US stocks are in good shape as we approach the end of the building season.