
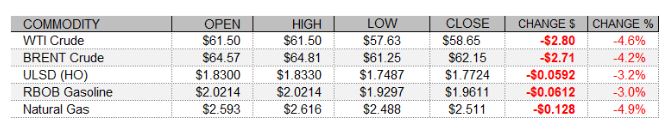
PETROLEUM COMPLEX (WTI | BRENT | ULSD | RBOB)
The complex fell sharply today despite strength in global shares and weakness in the US dollar, perhaps as the market more completely digested the OPEC+ output increase schedule for the coming months. After all, OPEC+ is set to increase output by a total of 1.1mb/d from May through July, and Saudi Arabia is set to increase production by an additional 1.0mb/d as it phases out its voluntary output cuts. European shares strengthened today, with the FTSE 100 gaining 0.35%, the DAX strengthening 0.66%, and the CAC 40 closing 0.59% stronger. US shares were seeing even larger gains as of this writing, following an encouraging report on the US service sector. The ISM Services Index for March came in at 63.7, well above consensus at 58.6 and a big jump from a 55.3 print in February. US factory orders figures for February were a miss, as orders fell 0.8%, against expectations for a 0.6% dip - but there were base effects as January order growth was revised up by 0.1 percentage points to 2.7%. As of this writing, the Dow was up 1.1%, the S&P 500 had strengthened 1.4%, and the Nasdaq had rallied to a 1.6% gain. Also supportive for crude, the US dollar index had dropped 0.49%.
NATURAL GAS | WEATHER | INVENTORIES
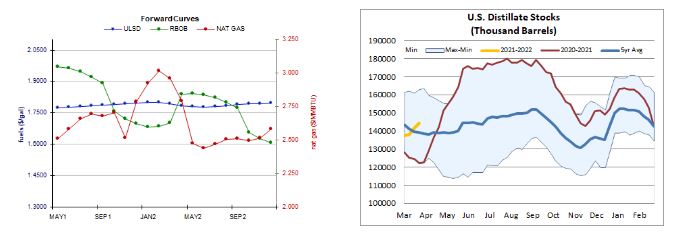
Natural gas futures prices on NYMEX fell sharply today as the temperature outlook moderated. The Global Forecast System slashed its two-day heating degree day forecast from 174 to 129, well below last year's 205 HDDs and also the 30-year average of 184. The latest 1-5 day ECMWF outlook calls for temperatures in much of the Midwest to average double digits above normal, and above-normal temperatures are the expectation in the Northeast as well. Next-day cash natural gas prices saw flat-to-lower movements. Benchmark Henry Hub prices held at $2.52/mmBtu and Algonquin citygate prices shed 1 cent, slipping to $2.56/mmBtu, while Transco Zone 6 prices in New York dropped 16 cents to $2.28/mmBtu. Looking further out, the 6-10 day ECMWF forecast calls for above-normal temperatures east of the Mississippi.
ENERGY TECHNICALS (WTI | ULSD | RBOB | NG)
ULSD futures trade remains highly volatile but mostly sideways now for the past eleven sessions, with trade capped above by $1.8330 (23.6% retracement of the Great Recession) and below by the recent low of $1.7295. Bears took out the 50-day ma ($1.7959) today, and this is nearby resistance followed by the aforementioned $1.8330, whereas we look to $1.6553 (23.6% retracement of the pandemic recovery rally) after $1.7295 support. Indicators are mixed, with a neutral RSI, MACD, and candlesticks, and while the ADX indicates a downtrend, it is weakening. Meanwhile, major averages are slightly bullish but fast becoming neutral. RBOB futures fell 3.0% today in a downside session. Trade here has created an upward price channel over the past nine sessions, but with large daily moves and the climb has hardly been monotonic. We remain sidelined, seeing resistance at the 18-day ma ($2.0096) and then up at $2.1108, whereas the 50-day ma ($1.8526) and then $1.7475 (23.6% retracement of the pandemic recovery) are seen offering nearby support. WTI futures dropped 4.6% in a downside session, but here too we have very volatile yet sideways trade over the past eleven sessions. The MACD is neutral, nearly bearish, and slow stochastics point south, but the major averages are still neutral/bullish. We remain neutral, seeing 9-day ma ($60.00) resistance (this had been nearby support but was taken out today), followed by the 18-day ma ($61.88), while $57.21 and then $55.58 are our nearby support levels. Finally, NYMEX natural gas futures, where we were neutral, fell 4.9% in a downside session. Bears tested 200-day ma support ($2.492) but failed, and we remain neutral for now, looking out for bearish confirmation. After the 200-day ma, we see support at $2.403, whereas $2.758 and then $2.898 are our nearby resistance levels.