
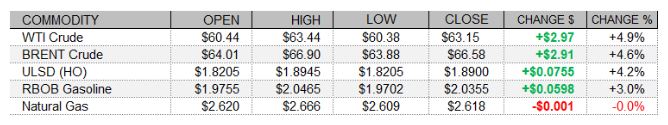
PETROLEUM COMPLEX (WTI | BRENT | ULSD | RBOB)
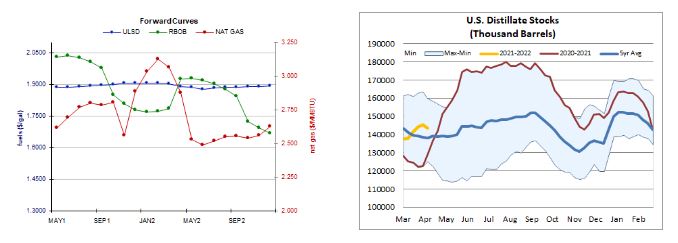
The complex rallied today, led by WTI, following bullish weekly EIA crude oil and distillate stock data, a continued sell-off in the US dollar index, and mixed but mostly higher trade in US and European shares, as well as a bullish note on demand in the monthly oil market report from the IEA. The Paris-based agency stated that "fundamentals look decidedly stronger," and that it expects the global oil demand and supply to rebalance in the second half of the year - but also noted concern over rising cases in the US, Brazil, and Europe. Also supportive, the US EIA reported a surprisingly large drop in US crude oil inventories for the week ended April 9, along with a surprise draw from distillate stockpiles. While gasoline stocks rose slightly, as expected, we saw a second week where implied demand held above its weekly five-year average. See our DOE Report for more. Also supportive for crude today, the US dollar index fell for a third consecutive session, and has been trending lower since March 31. Additionally, while the DAX lost 0.17%, the CAC 40 rose 0.40% and the FTSE 100 climbed 0.71% higher. As of this writing, the Nasdaq was down 0.25%, but the S&P 500 was up 0.09% and the Dow had gained 0.57%.
NATURAL GAS | WEATHER | INVENTORIES
Natural gas futures were little changed today, despite generally supportive developments. The Global Forecast System raised its two-week heating degree day forecast by 12 to 168, topping the 30-year average of 148 although not last year's 197 HDDs during the same period. Consistent with this revision, Refinitiv analysts raised their total US demand forecast for next week by 1.1 to 94.4bcf/d, and with the supply forecast steady, analysts see smaller injections of 3.6bcf/d next week (compared to 4.7bcf/d previously). The latest 1-5 day ECMWF outlook calls for mostly below-normal temperatures across the country, although more mixed, near-normal temperatures are expected in the Northeast. In the cash market, Henry Hub prices rose 7 cents to $2.57/mmBtu, Transco Zone 6 prices in New York gained 14 cents, reaching $2.03/mmBtu, and Algonquin citygate prices strengthened 14 cents to $2.07/mmBtu. The 6-10 day outlook is supportive, with below-normal temperatures expected across most of the country, and with large deviations below normal expected in parts of the Midwest.
ENERGY TECHNICALS (WTI | ULSD | RBOB | NG)
ULSD futures jumped 4.2% in an upside session (higher high, higher low) – breaking out of the sideway trade that we have seen for the past 17 sessions. Bulls took out both the 50-day ma ($1.8259) and the $1.8330 resistance levels, which now become our nearby support, while $1.9000 and $1.9695 are our resistance levels. Slow stochastics, the RSI, and candlesticks are all bullish, while the MACD is neutral but looks set to cross the zero line and become bullish. We are going to take a neutral/bullish stance now, noting that there could be a retracement in the next session after a rise of this magnitude. RBOB futures, where we were also neutral, rose 3.0% in an upside session today with bulls testing but failing to take out the $2.0360 resistance level. Slow stochastics and the RSI point higher, along with candlesticks, while the MACD is neutral. We are going to take a neutral/bullish stance here as well, noting that a retracement could be possible in tomorrow’s session. Nearby resistance is seen at $2.0360 and then up at $2.1108, while the 18-day ma ($1.9680) and the 50-day ma ($1.9085) are expected to offer support. Similar to products, WTI gapped higher overnight and rallied intraday to settle 4.9% higher in an upside session. We are going to take a neutral/bullish stance now, still seeing nearby support at the 9-day ma ($60.13), followed by $57.21, while $63.75 and $67.98 remain our nearby resistance levels. Technical indicators are similar to those in ULSD and RBOB and we again note that a retracement could be possible tomorrow. Lastly, natural gas futures, where we were neutral/bullish, settled flat in an upside session – somewhat consistent with our bias which we maintain. We continue to see nearby support at the 200-day ma ($2.526) and then down at $2.403, whereas $2.758 and $2.898 are seen offering resistance.